
Google Robocalls: What To Do If You Get A Phone Call About Your Google My Business (GMB) Listing
100% of these calls are a scam, and here is what you need to do…
Just hang up.
For no reason should you give any personal information, or hire the caller to help verify or claim your business listing.
The Google listing phone call is not coming from Google. Google does not call about listings.
Read on to get all the details about these scam calls, and how to actually verify and update your Google business listing.
But one last time, please understand — if anyone ever says they are calling you from Google they are LYING.
Sorry to harp on that point.
Even when we explain this to clients, by the end of the talk they are asking what to do the next time their “Google rep” calls. And we have to say, yet again, that person is not working for or with Google. Far too often we hear of clients who have paid to some random company a subscription for services that Google offers for free.
Again, the call is Not Google.
 There will never be an emergency or an urgent problem with the way that search results show your business info. If you ever feel pressured when it comes to Google, it’s a sign that someone is trying to con you.
With that out of the way, let’s go over all the details you need to know about the Google My Business options.
Click any of the links below to jump to the most important topic for you right now.
And don’t worry — this article is for small business owners. So there will be no confusing tech jargon.
Just simple explanations so you can protect yourself and understand how the local search directory works.
There will never be an emergency or an urgent problem with the way that search results show your business info. If you ever feel pressured when it comes to Google, it’s a sign that someone is trying to con you.
With that out of the way, let’s go over all the details you need to know about the Google My Business options.
Click any of the links below to jump to the most important topic for you right now.
And don’t worry — this article is for small business owners. So there will be no confusing tech jargon.
Just simple explanations so you can protect yourself and understand how the local search directory works.
What A Google Listing Phone Call Scam Sounds Like
It could be a robocall asking you to press 1 to verify, or press 7 to be removed from a list (you won’t actually be removed). Or it could be an actual person who is “alerting” you that you are not showing up on Google, or that there is a problem with your listing. They might even say your listing is “scheduled for deletion” or “flagged for removal”. Finally, they could offer to sell you a “lifetime Google listing at a discount”. If you do not let them bamboozle you, and you ask some pressing questions, they will usually admit they are not Google, but may say they are “working with” Google. They’re not. These calls happen so often, that the actual support team from Google had to release a public statement. They gave a list of some things that they would NEVER do:- they don’t charge for inclusion in Google My Business or in Google Search
- they don’t offer to improve your search ranking or manage your business’s online profile
- they don’t ask you for your password or for a verification code
What To Do If You Already Got The Google Phone Call & Are Paying For Help
First, don’t worry too much. These scammers are just trying to overcharge you for a simple service you could get for free, or that you could do yourself. So the worst thing that happened is you just over-paid for the “help”. You may even be on a monthly payment plan. If you try to cancel, the phone rep could try to scare you by saying that your site will drop out of the Google search, or some other bad thing will happen. It won’t. The first thing you should do is to remove their access from your page. Go here: https://www.google.com/business/ You may already be signed in on your computer. If not, you’ll need the email tied to your Google Account, as well as the password of your Google account. Here are the instructions to remove a manager from your Google listing: https://support.google.com/business/answer/3403100?hl=en Once you have removed any control this scammer may have, you can stop paying them. If they have you on recurring billing and will not stop it, call your credit card company to explain the situation.What Is A “Google Partner”?
To further protect you, it helps to know some terms. There is a title called “Google Partner”.
This is a third party agency or marketer that took some basic online training and got a certification from Google.
All it really means is that the agency / marketer has at least an entry-level understanding of how Google services work. It does not guarantee you (the small business owner) any results.
So someone might call you and offer to help you show up higher in the search results for a specific phrase, or to run pay-per-click ads for you.
They might let you know they are a Google Partner.
As long as they don’t claim to be working with or for Google, or promising specific results, you can just weigh their offer versus the cost like any other service.
We list some red flags for scammy SEO providers here.


 Well, so what do they want? Too often business owners and marketers will be so concerned with our desires for immediate gratification, that we forget the most important part of the user experience is to first know what the user wants to begin with. The User’s wishes have to be fulfilled, and this can only be done by understanding what their actual wants are.
 In the end, the most likely reason a user will be at your site is the content they are searching for. Ensuring that you have the right content for your target market is always the starting point of a strong User Experience Web Design and Development strategy.
A futuristic idea is to eventually engage with more than just dynamic content. Some sites and developers are trying to design and develop with predictively created content in mind. No, this isn’t a reference to retrieving content predictively for an individual, but to aggregated and create content customized for that individual, based on their wishes. Many apps and sites are trying this now, but are still locked in predisposed rules, there is some traction to developing a truly customized experience with completely original and created content based solely on the user’s desires. The option of AI responsiveness is also worth mentioning since it would be the logical step forward in producing a truly responsive development. How long something like that will take to get here is only limited to our motivation to bring it.
In the end, the most likely reason a user will be at your site is the content they are searching for. Ensuring that you have the right content for your target market is always the starting point of a strong User Experience Web Design and Development strategy.
A futuristic idea is to eventually engage with more than just dynamic content. Some sites and developers are trying to design and develop with predictively created content in mind. No, this isn’t a reference to retrieving content predictively for an individual, but to aggregated and create content customized for that individual, based on their wishes. Many apps and sites are trying this now, but are still locked in predisposed rules, there is some traction to developing a truly customized experience with completely original and created content based solely on the user’s desires. The option of AI responsiveness is also worth mentioning since it would be the logical step forward in producing a truly responsive development. How long something like that will take to get here is only limited to our motivation to bring it. Using this definition, let’s consider how best to ensure a quality user experience from start to finish. The user experience has to start with empathy for what the user would wish to encounter in your digital business profile. More and more digital customers want the same effort for an experience placed into digital media as they would expect for arriving at your business in person. For too many years, the marketing method of welcoming users to a site was to simply inundate them with data and articulate information. While both are important, the same can be garnered using a billboard. Instead, we need to consider how to welcome them to our sites, even if we are ranking the top for a keyword. (what is the point of ranking the highest if you also have the highest bounce rate?).
So, we start with empathy:
Why did this customer search this term?
Choosing keywords needs to be user oriented. For too many years, marketing director and SEO gurus have chosen keywords solely based on sales and conversions with little regard to additional reasons a customer may come to their site, as a result, the market has been marginalized when it comes to keyword targeting.
Users are not completely satisfied with Search Engine Results now due to the mixed bag of outcomes in the results. Much of this is the fault of our SEO Strategies that have pushed businesses to the tops of search results by providing the best answer in text, even when they may not be the “best answer” in reality. This has caused the modern consumer to become less and less impressed by search engine placement. Don’t get me wrong, local services and immediate need sales are still in vital need of top placement in the search engines, but the non-immediate purchases are becoming more and more thought based.
Local searches for plumbers will certainly still benefit from the top listing in organic and map, but what about for their non-emergency sales? The searching customers not requiring an impulse purchase are becoming more reliant on user investigation and “purchase assurance” than just the need to address the issue in the easiest way possible.
As a society, we are becoming more diligent about the items we individually care most for, and as a result, our marketing methods have to shift to accommodate for digital narcissism. We are obsessed with the desire to garner the attention of our fellows and become recognized as individual “truth givers” and “knowledgeable people” to our fellows.
People inherently work for the acceptance of others, and with the advent of the digital age, people have begun basing self-worth and assessment on how others view their ability to be knowledgeable resources of data and information. As a result, you should start by considering what the individual will be looking for to satisfy that internal need and proceed with a marketing strategy that incorporates this knowledge.
Google coined the term the “0” Moment marketing Truth, I would go to say that this is the precursor to it. Empathizing and breaking down the average user to his core understanding has to come first. Doing so allows us to choose keywords based off of what the user actually wants in the way of an experience, not just what we wish to sell them.
There are many deeper aspects to this line of thought. Next, we will discuss why finding the customer/visitors interests before they do is a vital use of this empathy and the next step in your User Experience Based marketing strategy.
Using this definition, let’s consider how best to ensure a quality user experience from start to finish. The user experience has to start with empathy for what the user would wish to encounter in your digital business profile. More and more digital customers want the same effort for an experience placed into digital media as they would expect for arriving at your business in person. For too many years, the marketing method of welcoming users to a site was to simply inundate them with data and articulate information. While both are important, the same can be garnered using a billboard. Instead, we need to consider how to welcome them to our sites, even if we are ranking the top for a keyword. (what is the point of ranking the highest if you also have the highest bounce rate?).
So, we start with empathy:
Why did this customer search this term?
Choosing keywords needs to be user oriented. For too many years, marketing director and SEO gurus have chosen keywords solely based on sales and conversions with little regard to additional reasons a customer may come to their site, as a result, the market has been marginalized when it comes to keyword targeting.
Users are not completely satisfied with Search Engine Results now due to the mixed bag of outcomes in the results. Much of this is the fault of our SEO Strategies that have pushed businesses to the tops of search results by providing the best answer in text, even when they may not be the “best answer” in reality. This has caused the modern consumer to become less and less impressed by search engine placement. Don’t get me wrong, local services and immediate need sales are still in vital need of top placement in the search engines, but the non-immediate purchases are becoming more and more thought based.
Local searches for plumbers will certainly still benefit from the top listing in organic and map, but what about for their non-emergency sales? The searching customers not requiring an impulse purchase are becoming more reliant on user investigation and “purchase assurance” than just the need to address the issue in the easiest way possible.
As a society, we are becoming more diligent about the items we individually care most for, and as a result, our marketing methods have to shift to accommodate for digital narcissism. We are obsessed with the desire to garner the attention of our fellows and become recognized as individual “truth givers” and “knowledgeable people” to our fellows.
People inherently work for the acceptance of others, and with the advent of the digital age, people have begun basing self-worth and assessment on how others view their ability to be knowledgeable resources of data and information. As a result, you should start by considering what the individual will be looking for to satisfy that internal need and proceed with a marketing strategy that incorporates this knowledge.
Google coined the term the “0” Moment marketing Truth, I would go to say that this is the precursor to it. Empathizing and breaking down the average user to his core understanding has to come first. Doing so allows us to choose keywords based off of what the user actually wants in the way of an experience, not just what we wish to sell them.
There are many deeper aspects to this line of thought. Next, we will discuss why finding the customer/visitors interests before they do is a vital use of this empathy and the next step in your User Experience Based marketing strategy. Instead of trying to rank for random and "got lucky" terms, or trying to convert those who arrived at your site while looking for something your don't actually provide, your site team should be planning specific Inbound Marketing terms to use in your Search Traffic Strategy (STS).
  Your STS strategy should culminate with one specific goal: converting visitors to your site's primary purpose. If you have an ecommerce site, then the your strategy should focus on targeted traffic likely to desire your products. The same holds true for services, content, blogs or any other type of site you are trying to deliver qualified search traffic to.
There are many blogs offering "Top 5 Search Strategy", or "6 Search Traffic Items You Can't Ignore", and any other spammy title of the like, but these are more for promoting that SEO Company's blog than to assist you in your goals. Instead, we are going to simply list a couple of common sense solutions to amplify your Search Traffic Strategy and boost your converted inbound marketing. You'll find tons of blogs pushing strategies like the image below, but effectively, throwing all the crap at the wall and hoping it sticks isn't a strategy for anything but mayhem.
Your STS strategy should culminate with one specific goal: converting visitors to your site's primary purpose. If you have an ecommerce site, then the your strategy should focus on targeted traffic likely to desire your products. The same holds true for services, content, blogs or any other type of site you are trying to deliver qualified search traffic to.
There are many blogs offering "Top 5 Search Strategy", or "6 Search Traffic Items You Can't Ignore", and any other spammy title of the like, but these are more for promoting that SEO Company's blog than to assist you in your goals. Instead, we are going to simply list a couple of common sense solutions to amplify your Search Traffic Strategy and boost your converted inbound marketing. You'll find tons of blogs pushing strategies like the image below, but effectively, throwing all the crap at the wall and hoping it sticks isn't a strategy for anything but mayhem.
 Instead, make a decisive list of keywords to track, and pay little, if any attention to the others without traffic data to legitimize them as useful terms. You will want to ensure that your keywords are ones that convert traffic and sales, and as a result, this will be a criteria needing regular investigation. Again, this is where the scared SEO Tech will bring up ranking for random terms, but be mindful that these terms will need serious scrutiny. When adding additional terms to your watch list, ensure that they produce. Search new keywords in "Google Trends" to see if they have any ranking. This is especially true when you dig down to your local market. If you rank #1 for a term that gets 1 local search per month, then it might not be one worth nurturing.
If your SEO Expert tells you that this is a needed term, you may want to look for a more qualified representative. Ultimately, there will be new tools to pick up at every turn along the path, so most importantly, remain teachable. SEO and Search Traffic Strategy are fluid and will require updating methods to adapt to updated measures.
Instead, make a decisive list of keywords to track, and pay little, if any attention to the others without traffic data to legitimize them as useful terms. You will want to ensure that your keywords are ones that convert traffic and sales, and as a result, this will be a criteria needing regular investigation. Again, this is where the scared SEO Tech will bring up ranking for random terms, but be mindful that these terms will need serious scrutiny. When adding additional terms to your watch list, ensure that they produce. Search new keywords in "Google Trends" to see if they have any ranking. This is especially true when you dig down to your local market. If you rank #1 for a term that gets 1 local search per month, then it might not be one worth nurturing.
If your SEO Expert tells you that this is a needed term, you may want to look for a more qualified representative. Ultimately, there will be new tools to pick up at every turn along the path, so most importantly, remain teachable. SEO and Search Traffic Strategy are fluid and will require updating methods to adapt to updated measures. In the old days of Search Engine Marketing, and sometimes still true today, ad agencies would charge ridiculous amounts of money for ad driven traffic even when it had nothing to do with a site's content. Conversions were low and bounce rates were high. Today, the same is still occurring but now expanded to SEO campaigns. In Chicago it is far too common to find websites littered with footers pages for each individual township and suburb. At first, companies like Reach Local and Orange Soda did this as a way to push relevant content and lift their own clients in the SERPs. The problem was, these pages were comprised of the same city data, spun over and over, and leaving multiple sites with the same giant spam bomb in the footer and sitemap of each of their clients. Many freelance and smaller SEO Companies in Chicago followed this blueprint and littered the search results with more of the same. As a result, the practice became one of the basic principles to Chicago SEO tactics.
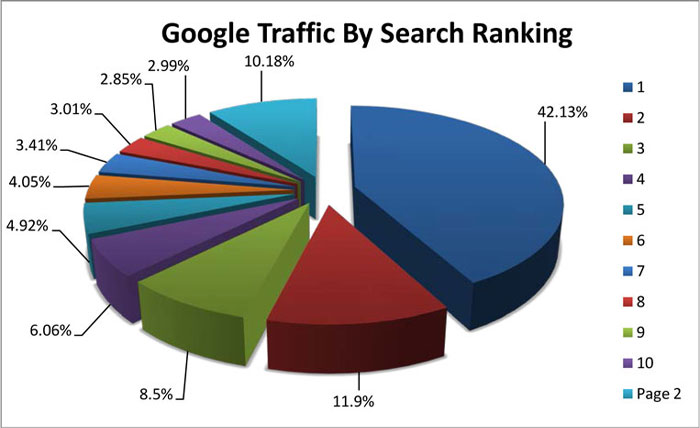
Poor overall traffic from high SEO placement is another problem. Imagine a keyword ranking at the #1 position but only delivering 50 visitors a month, and then a keyword that was ranking in the #6 position that was delivering 900 visitors a month - which one would you rather? Traffic numbers are much more valuable than rankings alone and converted traffic is the primary focus.
This cheap and semi-effective SEO and SERP placement method had a major downfall: when the sites received the positive listings resulting from all of the city data, they also received few visitors willing to trudge through the mounds of crap content to find what they were actually interested in. The basic remedy for this problem is the keystone for the framework of Search Optimized Traffic.
In the old days of Search Engine Marketing, and sometimes still true today, ad agencies would charge ridiculous amounts of money for ad driven traffic even when it had nothing to do with a site's content. Conversions were low and bounce rates were high. Today, the same is still occurring but now expanded to SEO campaigns. In Chicago it is far too common to find websites littered with footers pages for each individual township and suburb. At first, companies like Reach Local and Orange Soda did this as a way to push relevant content and lift their own clients in the SERPs. The problem was, these pages were comprised of the same city data, spun over and over, and leaving multiple sites with the same giant spam bomb in the footer and sitemap of each of their clients. Many freelance and smaller SEO Companies in Chicago followed this blueprint and littered the search results with more of the same. As a result, the practice became one of the basic principles to Chicago SEO tactics.
Poor overall traffic from high SEO placement is another problem. Imagine a keyword ranking at the #1 position but only delivering 50 visitors a month, and then a keyword that was ranking in the #6 position that was delivering 900 visitors a month - which one would you rather? Traffic numbers are much more valuable than rankings alone and converted traffic is the primary focus.
This cheap and semi-effective SEO and SERP placement method had a major downfall: when the sites received the positive listings resulting from all of the city data, they also received few visitors willing to trudge through the mounds of crap content to find what they were actually interested in. The basic remedy for this problem is the keystone for the framework of Search Optimized Traffic.
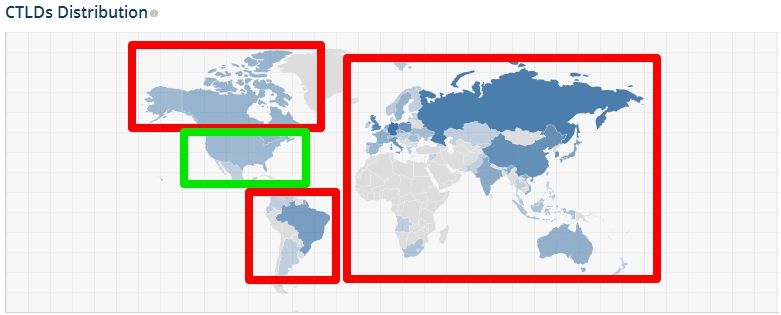
 The proliferation of the political scams is two fold; the first goal being to direct public opinion by preaching to a choir, the second being to drive traffic to sites filled with products aligned with the content itself. Many of the Natural News (and its affiliates site's) articles are solely produced to push traffic to their product affiliate sites for purchasing books or 'natural remedies". The traffic for survivalists will take them to sites promoting solar water heaters and wood-burning stoves (sold at ridiculously expensive prices at that). The scam site method is fairly simple, it only requires having a bunch of sheep ready to repost network stories for ad and clickbaited traffic. Often, most of the reproduction sites will be owned by the same group as the originating site.
The SEO methods used by reposting false information include medical info as well. In spite of medical science, the proliferation of false claims on medical needs is growing by the day. People, convinced in spite of science, that medical needs like vaccinations and treatments are some form of evil scam to make people sick (irony being that they avoiding the vaccines increases sickness) are increasingly promoting false narratives at the behest of their blogger overlords. Often, this information will be completely void of even the most basic scientific study. Again, Natural News is a notorious for the use of down-line blogging to perpetuate its SEO Content Countermeasures to recognized science. You may ask, "why would they do this to sell a few books?", and in doing so you will be asking a legitimate question. The answer is simple, they make millions off of affiliate book sales, vitamin sales, and training/event sales associated with the topics they push. In the end, the irony is that they claim the motivation for medical science to promote medical cures is money, while in the end, it is their own primary purpose. Obviously, Natural News and its many clone sites is an easy target, but it certainly isn't the only one. Often the hoax stories used on its network are dusted off months or years later to replicate the same affiliate gains. Even after pointed out to be the obvious lies they are, the dedicated who desire it to be true will promote the false stories without question.
Ultimately, public safety is put into jeopardy by these groups because of the purposeful direction of the public to act in a manner that is contrary to their health or basic common sense. Yes, the people who fall for and repromote this misinformation are guilty of being naive, gullible and ignorant, but those leading them by the snout are doing so in a way that is blatantly irresponsible and places large populations in danger... all to make a buck and push agendas.
Using SEO and Content Countermeasures to Hide Criminal and Legal Data
Someone will always be trying to invent a better mousetrap, but what happens when the mousetrap itself is under attack? People entrust their futures, businesses and family welfare to background and identity checks; what happens when the information gained from them is bogus? The answer is simple, the system fails those who deserve to know enough to protect themselves, their businesses and their families.
The proliferation of the political scams is two fold; the first goal being to direct public opinion by preaching to a choir, the second being to drive traffic to sites filled with products aligned with the content itself. Many of the Natural News (and its affiliates site's) articles are solely produced to push traffic to their product affiliate sites for purchasing books or 'natural remedies". The traffic for survivalists will take them to sites promoting solar water heaters and wood-burning stoves (sold at ridiculously expensive prices at that). The scam site method is fairly simple, it only requires having a bunch of sheep ready to repost network stories for ad and clickbaited traffic. Often, most of the reproduction sites will be owned by the same group as the originating site.
The SEO methods used by reposting false information include medical info as well. In spite of medical science, the proliferation of false claims on medical needs is growing by the day. People, convinced in spite of science, that medical needs like vaccinations and treatments are some form of evil scam to make people sick (irony being that they avoiding the vaccines increases sickness) are increasingly promoting false narratives at the behest of their blogger overlords. Often, this information will be completely void of even the most basic scientific study. Again, Natural News is a notorious for the use of down-line blogging to perpetuate its SEO Content Countermeasures to recognized science. You may ask, "why would they do this to sell a few books?", and in doing so you will be asking a legitimate question. The answer is simple, they make millions off of affiliate book sales, vitamin sales, and training/event sales associated with the topics they push. In the end, the irony is that they claim the motivation for medical science to promote medical cures is money, while in the end, it is their own primary purpose. Obviously, Natural News and its many clone sites is an easy target, but it certainly isn't the only one. Often the hoax stories used on its network are dusted off months or years later to replicate the same affiliate gains. Even after pointed out to be the obvious lies they are, the dedicated who desire it to be true will promote the false stories without question.
Ultimately, public safety is put into jeopardy by these groups because of the purposeful direction of the public to act in a manner that is contrary to their health or basic common sense. Yes, the people who fall for and repromote this misinformation are guilty of being naive, gullible and ignorant, but those leading them by the snout are doing so in a way that is blatantly irresponsible and places large populations in danger... all to make a buck and push agendas.
Using SEO and Content Countermeasures to Hide Criminal and Legal Data
Someone will always be trying to invent a better mousetrap, but what happens when the mousetrap itself is under attack? People entrust their futures, businesses and family welfare to background and identity checks; what happens when the information gained from them is bogus? The answer is simple, the system fails those who deserve to know enough to protect themselves, their businesses and their families.
 People of ill repute and those with a past worth hiding use SEO Countermeasures and Content Manipulation to promote a fictitious form of themselves so that their past, present and future victims are blind to the actual threats the individual can hold. We ran into a typical scammer recently who had an intricate manner of hiding reports of his previous scams. He produced so many member and blog accounts in his own name that even articles about his scams from Ripoff Report and NY Times were pushed to page 10.
Many are getting in on this option; from legal offenders to financial swindlers, the option allows them at least one more hustle and a crowd of people unable to find the sourced information about the scammer's history. The scammer mentioned above even went so far as to seek legal orders to force google to hide search results mentioning his name (since he apparently trademarked himself). As a result, attempts to find accurate information on this person who has scammed and stolen from so many are often in vain.
People of ill repute and those with a past worth hiding use SEO Countermeasures and Content Manipulation to promote a fictitious form of themselves so that their past, present and future victims are blind to the actual threats the individual can hold. We ran into a typical scammer recently who had an intricate manner of hiding reports of his previous scams. He produced so many member and blog accounts in his own name that even articles about his scams from Ripoff Report and NY Times were pushed to page 10.
Many are getting in on this option; from legal offenders to financial swindlers, the option allows them at least one more hustle and a crowd of people unable to find the sourced information about the scammer's history. The scammer mentioned above even went so far as to seek legal orders to force google to hide search results mentioning his name (since he apparently trademarked himself). As a result, attempts to find accurate information on this person who has scammed and stolen from so many are often in vain.
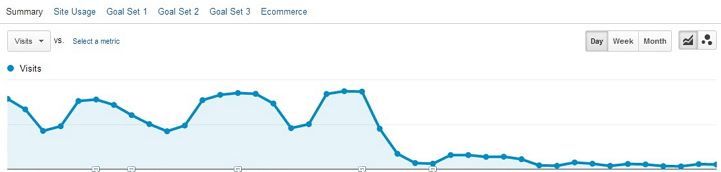
 The "push down" effect of Content Countermeasures and SEO Tactics used for these dishonest means are likely to persist. Google has given no indication that is has a real solution to counter the SEO Countermeasures being deployed. Google attempted to kill the duplicate content and spun material game, but only so much can be done when some of these scammers are running hundreds of accounts and sites to keep a clean image. They're wolves and their fake wool consists of the SEO Content and descriptors of themselves used to promote the false narrative.
We can hope that they will finally be curtailed, but they appear to be a constant from generation to generation. These are the same sad sacks that would be selling snake oil and 'miracle cures" in the 1800's. The unfortunate reality is that Content Countermeasures are only the latest tool of those who wish to defraud their fellows. That they have learned how to manipulate SEO techniques for these scams is only the latest step in a long walk. We can only assume that their growth online will continue, marking less honesty and more skepticism.
The "push down" effect of Content Countermeasures and SEO Tactics used for these dishonest means are likely to persist. Google has given no indication that is has a real solution to counter the SEO Countermeasures being deployed. Google attempted to kill the duplicate content and spun material game, but only so much can be done when some of these scammers are running hundreds of accounts and sites to keep a clean image. They're wolves and their fake wool consists of the SEO Content and descriptors of themselves used to promote the false narrative.
We can hope that they will finally be curtailed, but they appear to be a constant from generation to generation. These are the same sad sacks that would be selling snake oil and 'miracle cures" in the 1800's. The unfortunate reality is that Content Countermeasures are only the latest tool of those who wish to defraud their fellows. That they have learned how to manipulate SEO techniques for these scams is only the latest step in a long walk. We can only assume that their growth online will continue, marking less honesty and more skepticism.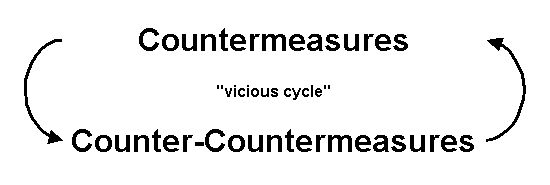 In some cases, this serves a very legitimate purpose, like incentivizing positive reviews and ratings from clients to overcome someone who griped about not getting his water and hot bread fast enough when entering a restaurant. There are certainly legitimate cases like this for businesses to present a positive image of themselves to the public. There is a duality of this topic as there are those who purposefully mislead the public with positive or negative spam of business content, causing a countermeasure to any possible chance of receiving accurate information. While this might seem like a trifle act, it damages the ability to have a reasonable expectation of receiving correct and verifiable data in search results.
"Reputation Management Scams"
In some cases, this serves a very legitimate purpose, like incentivizing positive reviews and ratings from clients to overcome someone who griped about not getting his water and hot bread fast enough when entering a restaurant. There are certainly legitimate cases like this for businesses to present a positive image of themselves to the public. There is a duality of this topic as there are those who purposefully mislead the public with positive or negative spam of business content, causing a countermeasure to any possible chance of receiving accurate information. While this might seem like a trifle act, it damages the ability to have a reasonable expectation of receiving correct and verifiable data in search results.
"Reputation Management Scams"
 When it comes to the dirtier uses of Content Countermeasures, the "
 No, I am not coming down on narratives themselves. As I said in the intro to this post, narratives are shaped by the marketer, but as soon as they are completely falsified narratives, then nothing is left but a dishonest scam being perpetrated on the reader. The petty marketers who believe that there is a magical line of lies they can hover on and still have their integrity intact are some of the most genuine and shining examples of cognitive dissonance available.
SEO Assassins
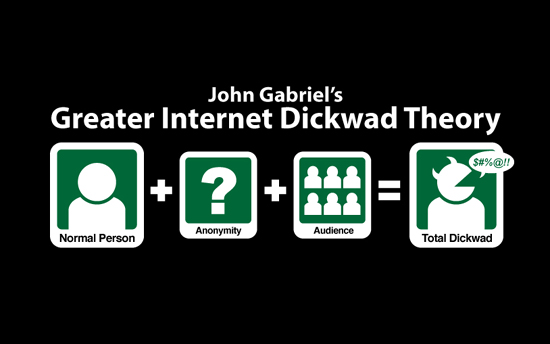
These are the lowest bottom-feeders of he internet. They include "Yelpers", "Competing Reviewers", and all the others willing to destroy. Content Assassins, or SEO Assassins are often written off as competitors or disgruntled employees, but we've found more instances lately of little to no association being the culprit. The internet gives strength to those who wish to do damage to others with impunity.
No, I am not coming down on narratives themselves. As I said in the intro to this post, narratives are shaped by the marketer, but as soon as they are completely falsified narratives, then nothing is left but a dishonest scam being perpetrated on the reader. The petty marketers who believe that there is a magical line of lies they can hover on and still have their integrity intact are some of the most genuine and shining examples of cognitive dissonance available.
SEO Assassins
These are the lowest bottom-feeders of he internet. They include "Yelpers", "Competing Reviewers", and all the others willing to destroy. Content Assassins, or SEO Assassins are often written off as competitors or disgruntled employees, but we've found more instances lately of little to no association being the culprit. The internet gives strength to those who wish to do damage to others with impunity.
 A restaurant client of ours apparently slighted a patron by serving his therapist. The individual saw this as a slight against him, and went on to commit a fake review and spam campaign to destroy the restaurant's reputation. Using a photoshopped comment image, the spammer made it appear that the restaurant (run by a gay man) had made anti-gay statements to him on Facebook. This one fake image, posted in several LGBT social media groups, caused over 500 negative reviews in one night. By the time the restaurant came to us, we had over 900 review accounts to send individual requests and explanations to.

 Even owners of a longtime, Glen Ellyn mom and pop establishments could have benefited from a simple website or inclusion in an online directory. We encountered a client who had absolutely no presence in any directory, yet had been in business in Glen Ellyn for over 30 years. We thought something like this would be impossible, but he was an internet ghost. It is not often that a local business owner says he or she has “too many” customers(although we may switch keywords at times to keep from peeking). In addition to regular, sustainable and residual customer, a web presence brings in new clientele that happen upon sites when looking for a product or service. Many websites cost very little to create and maintain, and results-driven online directories are affordable too. If you're unsure of where to begin in building an online following, hire someone to help you or contact us today. The money you invest will pay off over time and many companies offer a flat fee to maintain the site for you. Ultimately, if you don't tap the resource, it is an avenue of growth that your business will not experience.
 Remember that it is not enough to rely on word-of-mouth or traditional marketing techniques to bring in new local customers. Hanging your digital shingle in cyberspace is also vital and easier than ever to accomplish. Give potential customers the answers to their questions in an immediate way in order to win their business and not lose them to more visible competitors.
Beautiful Sites Unable to be Found in Search Engine Results.
This point is similar to having a lack of web presence but applies beyond the digital realm. Having a website is a great start, but the having one that is invisible to the search engines is nothing more than a place for people to go when they read your business card. One of our Naperville SEO clients learned this the hard way. He had a brilliant website, that was designed well, and written well; it was just all images and invisible to the search engines (warning, any images of text on your site are absolutely worthless). Ultimately, he brought us to his Naperville office to discuss a way to boost his Search Engine Optimization and elevate his listing in the SERPs. It took an entire rebuild of his site due to the poor decisions of his previous web designer, but we had him on the top of his 5 main keywords within a month.
Location Location Location
If people do not know where you are located, they cannot give you their business. We often work start Chicago clients who don't even have access to their Google+ and Local citation sites. This data is absolutely imperative to building business in the local market. This means promoting your web location in addition to your physical address. Unfortunately, people are so programmed to find the answers to all questions immediately that they will not take the time to track you down if a competitor offers ease of information. Additionally, with the improvements in local search functions on smart phones, over 50% of local market share is now going to the top 5-10 listings in a map search. Do whatever it takes to let people know where you exist, from web presence optimization to the signage outside your location to inclusion in web listings for your industry.
Take the Temperature
One of our Barrington Web Design clients was absolute in that he didn't care about what his clients thought of his services. That was, at least, until he started reading his reviews online. He soon found that reputation and feedback management are absolutely critical in the way of local business targeting.
There has never been a financial advantage to being an industry “best kept secret.” Ask customers how they found you and how you can improve your physical visibility. Those that are most loyal to your business will want to help and will be honest with you. Do not lose customers to frustration or impatience at having to track you down, instead make it easy to find you and even easier to buy your products or enlist your services.
It's Hard to Acquire Community Business without Community Outreach.
There is a reason that people say “the more you give, the more you get.” Find simple ways to give back to the community of your loyal clients and build your reputation for future local clients. Simple ways to get involved include sponsoring a local event, donating a product or service to a fundraising auction or volunteering at a local non-profit organization. Align your name with a cause that you believe benefits your client base and one that represents your business ideals.
Not only does outreach earn you the respect of the community, but it also creates a culture of social consciousness in your business, encouraging employees to reach out when they are off the clock too. You can feel satisfied knowing that you went beyond the call of duty to help the community and build a strong image of beneficence in the process.
Focus on local marketing does not have to be overwhelming. Find simple ways to reach out to your local audience through an online presence, easy-to-find location and outreach programs. By participating in just a few initiatives, you’re taking down some of the barriers that may be holding your business back. This then allows you to increase your business and root yourself in your community.
Remember that it is not enough to rely on word-of-mouth or traditional marketing techniques to bring in new local customers. Hanging your digital shingle in cyberspace is also vital and easier than ever to accomplish. Give potential customers the answers to their questions in an immediate way in order to win their business and not lose them to more visible competitors.
Beautiful Sites Unable to be Found in Search Engine Results.
This point is similar to having a lack of web presence but applies beyond the digital realm. Having a website is a great start, but the having one that is invisible to the search engines is nothing more than a place for people to go when they read your business card. One of our Naperville SEO clients learned this the hard way. He had a brilliant website, that was designed well, and written well; it was just all images and invisible to the search engines (warning, any images of text on your site are absolutely worthless). Ultimately, he brought us to his Naperville office to discuss a way to boost his Search Engine Optimization and elevate his listing in the SERPs. It took an entire rebuild of his site due to the poor decisions of his previous web designer, but we had him on the top of his 5 main keywords within a month.
Location Location Location
If people do not know where you are located, they cannot give you their business. We often work start Chicago clients who don't even have access to their Google+ and Local citation sites. This data is absolutely imperative to building business in the local market. This means promoting your web location in addition to your physical address. Unfortunately, people are so programmed to find the answers to all questions immediately that they will not take the time to track you down if a competitor offers ease of information. Additionally, with the improvements in local search functions on smart phones, over 50% of local market share is now going to the top 5-10 listings in a map search. Do whatever it takes to let people know where you exist, from web presence optimization to the signage outside your location to inclusion in web listings for your industry.
Take the Temperature
One of our Barrington Web Design clients was absolute in that he didn't care about what his clients thought of his services. That was, at least, until he started reading his reviews online. He soon found that reputation and feedback management are absolutely critical in the way of local business targeting.
There has never been a financial advantage to being an industry “best kept secret.” Ask customers how they found you and how you can improve your physical visibility. Those that are most loyal to your business will want to help and will be honest with you. Do not lose customers to frustration or impatience at having to track you down, instead make it easy to find you and even easier to buy your products or enlist your services.
It's Hard to Acquire Community Business without Community Outreach.
There is a reason that people say “the more you give, the more you get.” Find simple ways to give back to the community of your loyal clients and build your reputation for future local clients. Simple ways to get involved include sponsoring a local event, donating a product or service to a fundraising auction or volunteering at a local non-profit organization. Align your name with a cause that you believe benefits your client base and one that represents your business ideals.
Not only does outreach earn you the respect of the community, but it also creates a culture of social consciousness in your business, encouraging employees to reach out when they are off the clock too. You can feel satisfied knowing that you went beyond the call of duty to help the community and build a strong image of beneficence in the process.
Focus on local marketing does not have to be overwhelming. Find simple ways to reach out to your local audience through an online presence, easy-to-find location and outreach programs. By participating in just a few initiatives, you’re taking down some of the barriers that may be holding your business back. This then allows you to increase your business and root yourself in your community. Optimizing your website for local search is one of the top priorities.
There are a number of ways you can optimize your website for local search that will help attract local clients and customers. The first thing you need to do is identify your keywords. These are the words (usually a short phrase) that describe your business. If, for example, you run a wedding photography business, your keywords might be “wedding photographer.” To localize your business, add the city you target to that phrase, e.g. “Naperville wedding photographer" or "Glen Ellyn Wedding Photography.” Read the Small Business SEO Guide, do some keyword research to make sure the city + keyword phrase has strong search volume, then optimize your website for the best locally focused keywords using the on-site optimization tips in the guide.
Next, include a local street address and phone number (with a local area code, not 800 number) on each page of your website. Most businesses do this in the footer. This information must be on the website in text, not image format, so that search engines can crawl the information. If your business has multiple locations, the alternative is to put the primary location on each page and create individual contact pages for each location.
Tip: Make sure your website has a contact page for each location that includes the address, phone number, and a map helping customers find it. Adding photos of each location on the contact page is also a good idea.
Find the right local directories to join
Local directories and review sites are often referred to as “citations,” and they can help your business website rank well in local search results on Google. Here are the keys to ensuring each local directory and review site you join counts towards helping your business rank well in local search:
Optimizing your website for local search is one of the top priorities.
There are a number of ways you can optimize your website for local search that will help attract local clients and customers. The first thing you need to do is identify your keywords. These are the words (usually a short phrase) that describe your business. If, for example, you run a wedding photography business, your keywords might be “wedding photographer.” To localize your business, add the city you target to that phrase, e.g. “Naperville wedding photographer" or "Glen Ellyn Wedding Photography.” Read the Small Business SEO Guide, do some keyword research to make sure the city + keyword phrase has strong search volume, then optimize your website for the best locally focused keywords using the on-site optimization tips in the guide.
Next, include a local street address and phone number (with a local area code, not 800 number) on each page of your website. Most businesses do this in the footer. This information must be on the website in text, not image format, so that search engines can crawl the information. If your business has multiple locations, the alternative is to put the primary location on each page and create individual contact pages for each location.
Tip: Make sure your website has a contact page for each location that includes the address, phone number, and a map helping customers find it. Adding photos of each location on the contact page is also a good idea.
Find the right local directories to join
Local directories and review sites are often referred to as “citations,” and they can help your business website rank well in local search results on Google. Here are the keys to ensuring each local directory and review site you join counts towards helping your business rank well in local search: